Search Statistics Information Page
Administration section
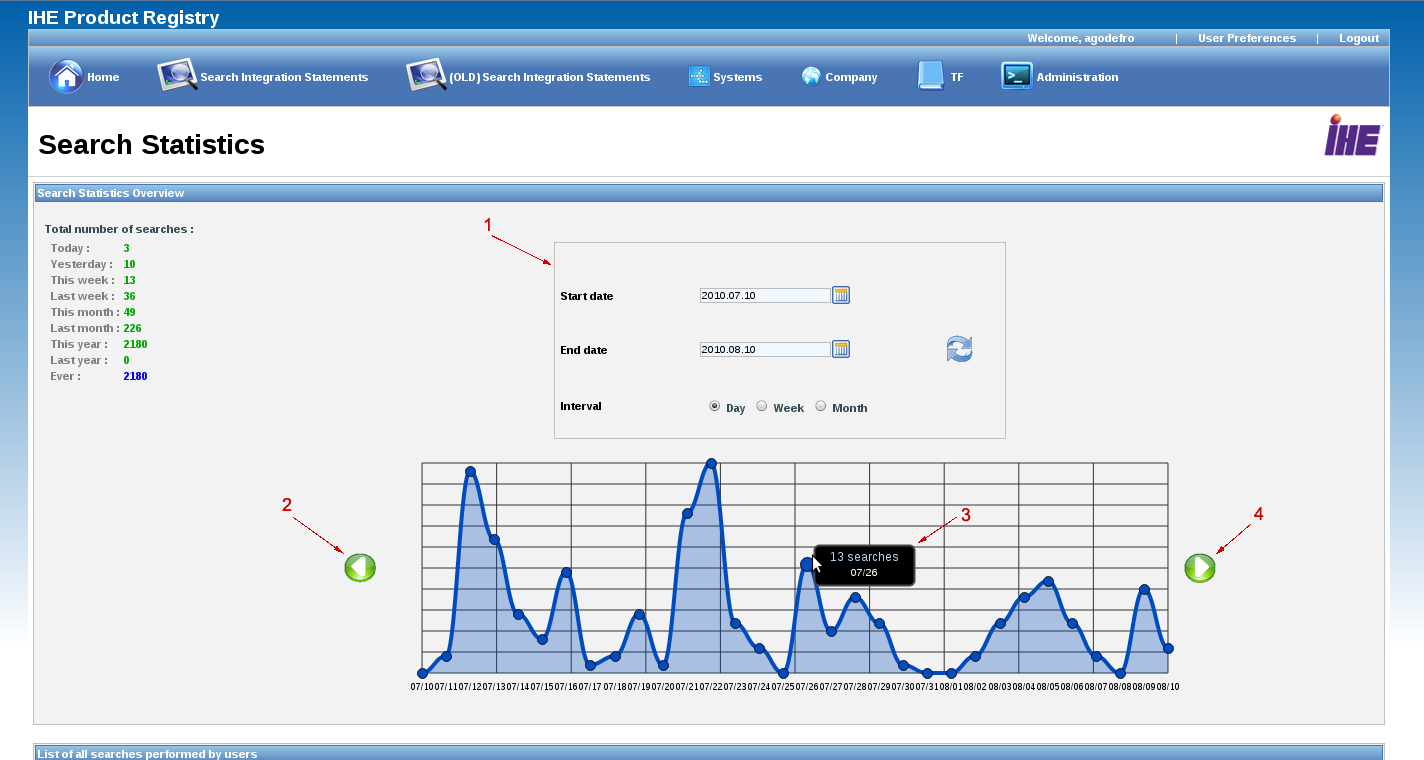
In this section, the graphical representation displays overall number of searches in the times.
Web user interface

- formular to generate a new graphic : select a beginning date, a end date and an interval size (day, week or month).
- go back in the times
- container displaying the number of searches for the interval whose the mouse is over it
- go forward in the times
Information page for a company
The information page of a company contains a graphical representation for the statistics. It's the comparison between overall number of searches and the number of searches where a system of the company was found.
For vendor-admin, the access to the graphical representation is different. The graphic is not on the edition/information page for the company. It's a new menu called "Consult company statistics".
Web user interface

- formular to generate a new graphic : select a beginning date, a end date and an interval size (day, week or month).
- go back in the times
- go forward in the times
- container displaying the number of searches for the interval whose the mouse is over it
- Log in to post comments