Connectathon Testing
Different category of tests
There are 3 types of test :
- No peer tests
- Peer to peer tests
- Group tests
Starting a Test Instance
Connectathon Dashboard
Gazelle Test Management users access the connectathon dashboard through the menu "Connectathon -> Connectathon " as shown on the following screen capture.

The dashboard offer advance filtering capabilities and allows the user to have an overview of the testing progress from different angles.

Monitor Workflow
Test validation workflow
- Find test in the monitor worklist
- Claim test (release it if necessary)
- Review test requirements
- Visit participants, look for evidence
- Grade the test
- Verified -> Done
- Failed -> Enter comments, done
- Partially Verified -> Enter comments, done
Gazelle Monitor App
The Gazelle Monitor application has been developed to help monitors validating tests without spending their time running from their desk to the participants' table. If the monitor own a smart phone with a WiFi connection, they will be able to claim and validate tests from their smart phone.
The GazelleMonitorApp is a tomcat application designed for mobile screens. It requires the installation of an application on the mobile devide that scans a QR code (for example http://en.wikipedia.org/wiki/QR_code).
The application you choose will depend on your device. You can download Barcode scanner, Google or other free applications from your market places. The use of MobileTag is discouraged since it accesses the links through an external server, and that will not work from most connectathon floor.
We have successfully tested the application with Android phones, iPhones and Windows phones.
In Europe, you will access the application at the following URL : http://gazelle.ihe.net/GazelleMonitorApp , the QR code leading to this application is given below:
How to proceed
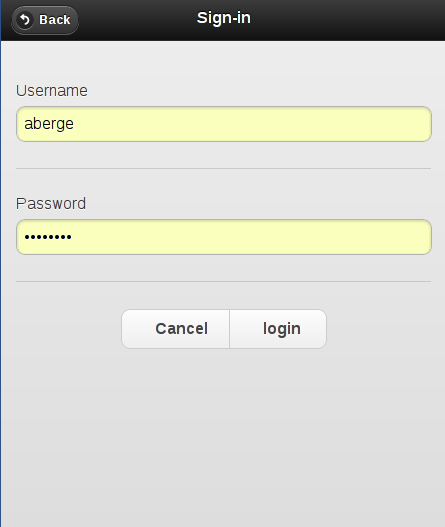
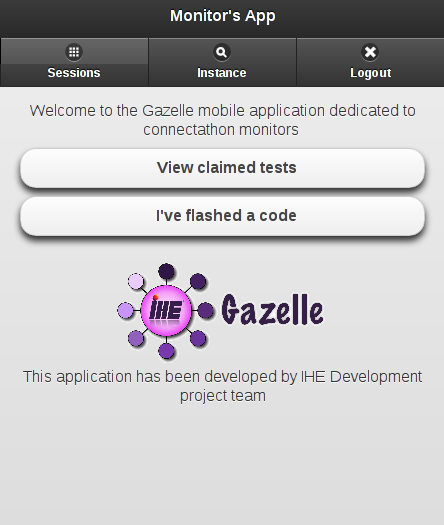
After you have installed the QR scanner, connect your mobile device to GazelleMonitorApp application and sign in using your login and password; they are the same as what you use to connect to Gazelle (Test Management). Once the application has identified you, a cookie is stored in your (mobile) browser for 7 days (connect-a-thon duration) so that you will not have to sign in again even if your session expires. If it does not work, check that cookies are enabled in your browser. To remove this cookie, go to the application home page and use the "logout" button.
|
Home page |
|
This workflow assumes that you have claimed one or more tests from the Gazelle Monitor Worklist, most likely using a laptop/PC. Once you are logged in with your mobile device, hit the "View claimed tests" button. If you are monitor at a Connectathon that is currently in progress, you will see the list of available testing sessions, as shown below. Selecting one of the testing sessions will lead you to the list of test instances you have claimed for that testing session. To select another testing session use the "Sessions" button of the navigation bar.
|
Choose your testing session |
Here is the list of test instance you have claimed and which still need work |
summary of a test instance. Click on update to see details and verify it, click on unclaim to release it |
A second workflow allows you to claim a test directly with your mobile device. You can do this at the participant table or using Gazelle at your laptop/PC. At your laptop/PC, go to Connectathon --> Monitor Worklist, you will see the list of test instances you can verify and claim them. Select a test instance by its identifier (id). When that brings up the Test Instance page, a QR code is displayed beside the metadata of each test instance (see the photo below). By scanning this QR code, for instance, you will be lead to the home page of GazelleMonitorApp; hit the "I've flahed a code" button, the test instance will appear (if you have access rights !)
|
Run a QR code scanner and flash the code |
Click on "I've flashed a code" to confirm and display the test informations |
Update informations and submit the result ("submit" button at the bottom of the page) |
By clicking the "View selected test instance" you confirm that you want to claim this instance. Nevertheless, the application may not be able to assign you this test for one of the following reasons:
- No test instance with the given id has been found within Gazelle
- You are not logged in or not a monitor for the testing session in which the test instance has been performed
- The test instance has already been claimed by someone else
- The test instance status is not either "to be verified", or "critical", or "partially verified"
- The connect-a-thon in which the test instance has been performed is over
When you get the screen with the test instance information, change the test status to failed, passed or patially verified. You may optionally change the status of individual test steps or leave a comment before submitting the result. If you want to add a long comment or if you prefer to change the step status using Gazelle Test Management, submit only the test status using the mobile app and then go to GazelleTest Management for further work. You can easily retrieve a test instance by its id using the search bar at the top of the home page of Gazelle Test Management on your laptop or PC.
Test Instance Workflow
Test Instances Statuses
A test instance can have the following statuses :
- Running : this is the initial state of a test instance, once the user press on the "Start" button.
- Paused : A test instance can be paused, and the restarted by the user.
- Aborted : If the test instance was started per mistake, or is a duplicate of an existing test instance. Then one can abort it. Aborted test instances are not checked by monitors.
- To be verified : Once a test instance is completed, the user can set it status to "to be verified". Monitors work list contains test instances with that status.
- Failed : Based on the evidences and the observation of the logs or the actual run of the test by vendors, a monitor may fail a test.
- Verified : A monitor once convinced that the test is successful can mark it as verified
- Partially verified : If a monitor thinks that a test is incomplete but that their is a chance that the vendor may fix the problem during the test session, then he/she can mark the test as partially verified.
- Critical : Sometime toward the end of the connectathon, the project manager activates the "critical" status mode in Gazelle. Monitors verify then the Test instances with the status critical first.
Test Instances Transitions states
From the Vendor perspective

From the Monitor perspective
Monitors work on test instances that have one of the 3 following status:
- To be verified,
- Critical or
- Partially Verified.
The output status are :
- Failed
- Verified
- Partially Verified

Complete state diagram for Test Instances

Validation of test steps logs within test instance
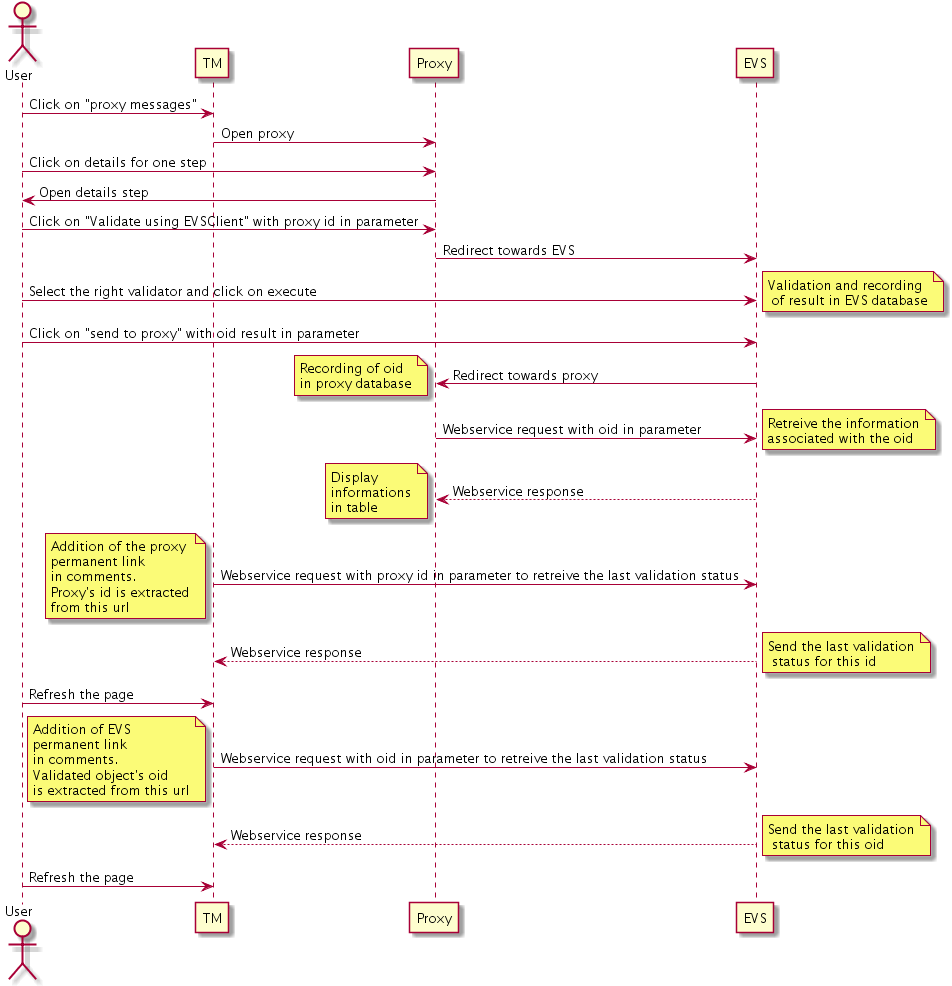
The aim of this page is to explain how the validation result displayed on a test instance page are retrieved from the EVSClient tool.
When a test instance is created, the page looks like:

The are different possibilities, like the next sequence diagram shows :

If we choose the first case, which is to add the permanent link from the proxy in a step message :

When it 'is added :

The file is to be validated in Proxy to EVSClient, the test instance page looks like (use the refresh button is not) :

We can see in data column the last validation status from EVSClient.
We can see in EVSClient status column :
-A color button (green=passed, blue=unknown or not performed, red=failed)
-The last date when the status was verified
-The refresh button
If the user clickon color button, then he is redirected towards the last result of validation.
If the user click on refresh button, then TM reloads the last validation status.
The button's color evolves according to the result and the date is update.
Generate and Share patient data
One of the numerous functionnalities of Test Management is called "Patient Generation and Sharing". This feature, available under the "Connectathon" menu, enables testers to generate patient demographics and to share them among systems registered within Gazelle for the same testing session. In this way, systems involved in a same test can be pre-filled with the same patients, the ones will be used during the test process.
List of patients
The first tab available in the "Patient Generation and Sharing" page is entitled "Existing patients". It list all the patients registered in Test Management, you can restrain the list of patients using the filters available in the table column headers. If you need to find a patient created by yourself, select your username in the "Select creator" drop-down list.
For some of the patients, the "test keyword" column is filled, it matches the test keyword in which you have to use this patient. For instance, if you want to pre-fill your system for testing PIX, enter "PIX" in the filter box of the "Test keyword" column, you will get the list of patients to use for this set of tests.
Update patient data
Test Management enables you to edit a patient in order to update his/her demographic data. Actually, instead of updated the information in the database, a new patient is created with the new demographics and the original patient cannot be updated anymore. For the new patient, a link to the "original patient" is made. To access this feature, use the edit button displayed on each row of the table ![]() (except for patients already updated once).
(except for patients already updated once).
Share a list of patients
Using the "Export as CSV file" link, below the table, you will get a CSV file gathering all the demographics data for all the patients displayed in the page. If you need patients displayed on several pages, please, before clicking on that link, increase the number of "results per page" in a manner that you will see all the patients you want to export.
In the same way, the ![]() button at the bottom of the page enables you to share those same patients using an ADT message. See below for explanations about how to set the sending options.
button at the bottom of the page enables you to share those same patients using an ADT message. See below for explanations about how to set the sending options.
Share a patient
The tab entitled "Share patient" is available only if at least one patient is selected. The purpose of this page is to send HL7 messages to the CAT participants in order to help them with sharing the same patients demographics. You will first have to select the message to send and then to select the systems to which send those messages.
Four HL7 message types are available in this section:
- ADT^A01^ADT_A01 (HL7v2.3.1)
- ADT^A04^ADT_A01 (HL7v2.3.1)
- ADT^A28^ADT_A05 (HL7v2.5)
- PRPA_IN201301UV02 (HL7v3)
Depending if you select a message with a version equals to HL7v2.x or HL7v3, the list of available systems will gather systems registered with respectively an HL7v2 Responder or HL7v3 Responder configuration approved within Gazelle. Those systems are listed by HL7 Responder actors. Select all the systems you need (by double-clicking on a system, it will pass from a box to the other). Once the systems, for a given actor, are selected, click on the "Add selection" button. The systems and their configurations will appear in the table below.
If the system you are looking for is not available in the displayed list or if you are using this functionality out of a connectathon period, you may want to manually enter the configuration of the system (IP address, port, receiving application/facility ...). To do this, use the form available in the right hand part of the screen.
You can use at the same time Gazelle and manual configurations. When all of them are selected, click on the "Send Message" button.
A table will then appears which gathers all the logs of the event. For each selected systems, the message sent by Gazelle and the acknowledgment received are stored there; so that you can see which systems received and integrated the message.
Generate a patient
This part of the tool is available under the "Generate patient" tab. The generation of patients' demographics and addresses is done calling the webservice offered by the Gazelle tool named Demographics Data Server (DDS). The generator can be configured to return or not such or such data. For instance, you might not want your patient to have a religion or a race but you want it to be called MY_COMPANY MY_SYSTEM. You can do that. Select the "random" option for the generation of names and fill out the first name and last name; also select the gender of the patient. Then, select the other criteria you want and click on the "Generate patient" button. After a while, the patient demographics will show up.
If you want to immediate share the just generated patient, click on the "Share patient" button, available under the patient's demographics.
Permanent link
Each patient can be accessed using a permanent link. This one is available in the page gathering the data of a particular patient.
Quick search
Using the quick search box available beside your username at the top of the tool, you can search the patient by its name, first name (criteria: Patient by name) or by id (criteria: Patient by id).
For learning more about this functionality and seeing annotated screen shots, refers to the attached pdf file.
- Log in to post comments

 login page, use your Gazelle account


